
Evidence-Analysis-Action: The Heart of Collaborative Inquiry
Continuous improvement cycles or inquiry cycles are central to successful school transformation efforts, providing a structured approach to identifying, implementing, and refining changes necessary for substantial and sustainable school improvement. Schools that successfully implement continuous improvement cycles with the collaboration of PLCs, ILTs (instructional leadership teams), and DLTs (district leadership teams) see positive impact. These changes are sustained by nurturing the enabling conditions of collective efficacy: shared decision-making, goal consensus, embedded reflective practices, cohesive teacher knowledge, effective systems of intervention, and supportive-restorative leadership (Donohoo, O’Leary & Hattie, 2020).
The inquiry process enables schools facing challenges to methodically test hypotheses, measure results, and learn from each iteration. Collaborative Inquiry cycles have six distinct phases:
- Frame Puzzle of Practice: Impact Teams frame a puzzle of practice to advance learner agency grounded in the learning community’s core values.
- Develop a Theory of Action: Teams formulate a theory of action to provide a logical, organized set of ideas and actions to guide their inquiry. Teams envision success by co-constructing success criteria to achieve their goal.
- Determine Sources of Evidence: Peer facilitators partner with teams to determine the sources of evidence (performance data, observation, student perception data, etc.) to guide their inquiry.
- Analyzing Evidence: Facilitators guide teams through the Impact Team Analysis of Evidence Protocol to analyze evidence. Teams learn how to make meaning of evidence by identifying patterns and themes and formulating conclusions. As teams refine their thinking, they continually revisit their theory of action.
- Take Collective Action: Teams take collective action based on the analysis of evidence by identifying root cause(s). They anchor their actions in evidence-based, culturally responsive strategies focused on metacognition and self-regulation.
- Know Thy Impact: During this final stage, teams come together to memorialize and determine their impact on teaching and learning. Teams consider next steps by identifying additional student learning needs and reflecting on what they learned through their inquiry.
This systematic approach helps schools to pinpoint the most effective strategies for enhancing student learning and school culture. Through this process, schools not only address immediate areas of need but also develop the capacity to sustain improvements over time, ultimately transforming into a culture of efficacy.
Evidence of Impact
A culture of efficacy is a collective mindset within an organization or community where individuals believe in their ability to achieve desired outcomes based on evidence of impact (Bloomberg & Pitchford, 2023). People with collective efficacy are characterized by a strong sense of competence, confidence, and self-empowerment. In such a culture, people are motivated to take initiative, solve problems creatively, and persist in the face of challenges because they trust in their own capabilities and the support of their peers.
Collective efficacy beliefs are firmly grounded in evidence due to their reliance on observable outcomes or impact and tangible results. These beliefs stem from the collective experiences of a group or community, shaped by past successes and failures in achieving common goals. The evidence supporting collective efficacy often includes instances where cohesive groups have demonstrated their ability to overcome challenges and achieve desired outcomes through concerted effort and collaboration. Evidence plays a crucial role in strengthening collective efficacy for several reasons:
- Validation: Evidence provides validation that progress is being made. When Impact Teams-PLCs see tangible proof of their efforts yielding results, it reinforces their belief in their collective ability to enact change.
- Motivation: Concrete evidence of impact serves as a motivator. It demonstrates that the group’s actions are making a difference, encouraging members to continue their efforts and potentially even increase their commitment.
- Credibility: Evidence lends credibility to the group’s claims and goals. When presenting their objectives to stakeholders or the wider community, having empirical data to back up their assertions enhances the group’s legitimacy and persuasiveness.
- Learning and Improvement: Evidence allows for reflection and learning. By analyzing the outcomes of their actions, the group can identify what worked well and what didn’t, enabling them to adjust their strategies for greater effectiveness in the future.
Leveraging the Impact Team EAA Framework
Anchoring an inquiry cycle through the Impact Team three-phase framework, Eviden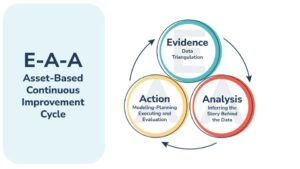 ce- Analysis-Action, teams can foster a collaborative, data-driven, reflective, and dynamic approach to improving processes and outcomes while balancing the relational demands of effective teaming.
- Evidence forms the foundation of continuous improvement cycles. This involves collecting evidence needed to anchor a team’s inquiry. Teams typically ground their inquiry in at least three evidence sources (ie: student work, student perception, class climate data, observation, etc.). The evidence collected is crucial because it sets the direction for the innovations to be tested. For instance, if data indicates low reading proficiency, the planning will revolve around interventions to enhance literacy skills. Team would gather at least three sources of evidence to anchor their inquiry. In this case, the team may choose: 1) a phonics screener, 2) a comprehension screener, 3) student reflection, 4) observation data.
- Analysis is central to inquiry. Data collected during inquiry is critically examined using the AOE Impact Team Protocol. This analysis involves looking at the outcomes of the implemented actions to understand their impact. It is a reflective practice that requires assessing whether the actions taken to address the identified needs are based on the initial evidence. For example, after implementing reciprocal reading, schools would analyze changes in reading scores and other indirect indicators like student engagement and/or student motivation in reading focused activities. They may also want to gather data on students’ ability to self-regulate to determine what strategy to use when they get stuck. This analysis helps in understanding what is working and what isn’t.
- Action follows analysis, where insights gained from the analysis lead to informed decisions about the next steps. If the analysis shows positive outcomes, the action might involve scaling up the successful strategies to a broader context or embedding them into regular practice. Conversely, if the results are less favorable, the action might include adjusting the strategies or trying alternative methods. This phase is critical as it translates insights into tangible changes, thereby closing the loop of the continuous improvement cycle and setting the stage for a new cycle to begin with enhanced planning based on new evidence.
By continuously moving through these phases, the inquiry cycle ensures that improvements are always grounded in solid evidence, thoroughly analyzed for effectiveness, and acted upon to refine or expand the interventions. This creates a culture of perpetual learning and adaptation, which is essential for achieving and sustaining high performance. In essence, evidence serves as a cornerstone for strengthening collective efficacy by providing the group with the feedback, confidence, motivation, credibility, learning opportunities, and resources needed to pursue their shared goals effectively.
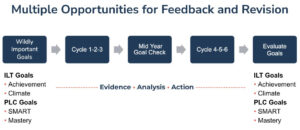
Frequency of Inquiry Cycles
The frequency of inquiry cycles that PLCs engage in can vary depending on several factors, including the school’s specific goals, schedule, resources, and the needs of the students. The typical PLC engages in data-driven inquiry at least 6-8 times across a year anchored in a school’s priority standards.Teams typically launch the year by examining state test data, climate data and universal screening data. Teams typically set annual SMART Goals anchored in multiple measures. A SMART goal is much more than simply saying that you want to learn about and/or improve on something; rather, it more specifically describes what you want to achieve. SMART goals for school improvement plans should be grounded in student outcomes – measures of what students know and are able to do. SMART goals, with their detailed structure, provide focus as well as a clear idea of what you want to achieve. This structure makes it easier to: develop success criteria, plan relevant action steps/activities, and measure progress toward achieving the goal.
Teams measure progress towards their SMART goals by developing Mastery Goals. Mastery goals are aimed at attaining a standard of competence defined by a school’s priority standards. Mastery Goals are designed to ensure that students master key skills and concepts anchored in their priority standards. Teams typically analyze evidence in each unit of study and then respond to students in a variety of settings (small group instruction, whole group instruction, intervention time, computer adaptive support, 1-1 tutoring, study hall, etc.). It is important that teams use a standard treatment protocol when determining impact. A Standard-Treatment Protocol (STP) is used when students with similar needs receive the same support plan. Teams use pre and post assessment to measure impact when adopting a STP. An inquiry cycle has these six critical components:
- Data Analysis: Teams examine student data to identify areas of strength and areas needing improvement.
- Goal Setting: Based on the data analysis, teams set specific goals for student learning and achievement.
- Instructional Planning: Teams collaboratively plan and design instructional strategies and interventions to support student learning and achieve the set goals.
- Implementation: Teachers implement the planned strategies and interventions in their classrooms.
- Assessment and Monitoring: Teams regularly assess student progress and monitor the effectiveness of the instructional strategies and interventions for impact.
- Reflection and Adjustment: Teams reflect on the outcomes of their efforts, adjust instructional practices as needed, and make plans for further improvement.
Education is not a one-size-fits-all endeavor, and student needs vary widely. Frequent inquiry cycles allow educators to adapt their approaches in real-time based on ongoing assessment data and student feedback. This responsiveness ensures that instruction remains relevant and effective for absolutely every learner so more students reach their learning pursuits.
Leading vs Lagging Indicators
Leading indicators and lagging indicators are crucial elements in the framework of continuous improvement, providing different insights into the effectiveness and efficiency of processes. Leading indicators are forward-looking metrics that predict future performance and signal upcoming changes. They are proactive measures, typically used to assess the potential success of a process or to identify risks before they manifest into larger issues. In schools, leading indicators are metrics that provide early signals about whether students and schools are on track to meet their educational goals. These indicators can help educators, students, families and administrators anticipate outcomes and adjust strategies accordingly. Here are some examples of leading indicators in education:
- School Climate: Gathering climate data on “sense of belonging” and “relational trust” is critical for school improvement because these elements play a foundational role in creating a positive and effective learning environment. A strong sense of belonging among students and staff correlates with increased engagement, motivation, and academic success, as individuals are more likely to invest effort and participate actively when they feel they are part of a supportive community. Similarly, relational trust—trust among teachers, between teachers and administration, and between the school and families—enhances collaboration and openness, facilitating the implementation of new ideas and approaches.
- Attendance Rates: Regular attendance is a strong predictor of academic success. Monitoring attendance rates helps identify students at risk of falling behind due to frequent absences.
- Student Engagement Levels: This can include participation in class, involvement in extracurricular activities, and engagement in school clubs. High engagement levels are often correlated with better learning outcomes and student well-being
- Formative Assessment Feedback: Unlike summative assessments that evaluate student learning at the end of an instructional period, formative assessments provide ongoing insights into student understanding and progress throughout the year.
- Early Literacy and Numeracy Skills: Tracking the development of basic literacy and numeracy skills in younger students can predict future academic achievement.
- Teacher Observations and Evaluations: Regular assessments of teaching methods and classroom environments can provide early indications of both effective practices and areas needing improvement.
- Rate of Behavioral Incidents: Monitoring behavioral incidents can help schools implement interventions to improve the learning environment and student outcomes.
Leading indicators are valuable for continuous improvement because they enable organizations to make preemptive adjustments and foster an environment of proactive management. In contrast, lagging indicators are retrospective, providing data on performance after the fact.
In continuous improvement cycles, lagging indicators are typically not favored because they reflect historical performance rather than providing real-time insights for proactive decision-making. However, they are useful for confirming long-term trends and measuring results against established benchmarks. Common examples include state testing data, unit summative assessment, end-of-year benchmark testing, end-of-year climate surveys, end-of-year suspension rates, etc. Lagging indicators are critical for evaluating the effectiveness of programmatic strategies and operational changes. They offer insights into outcomes that can be used to refine processes and improve future performance.
Together, leading and lagging indicators create a comprehensive view of a learning organization’s health and trajectory. By balancing these two types of metrics, learning organizations can more effectively manage their continuous improvement efforts. Leading indicators allow for quick reaction and preventative measures, while lagging indicators provide a clear, empirical assessment of past actions, helping to guide strategic decisions and operational adjustments. This dynamic interplay enhances an organization’s ability to innovate and improve continuously, ensuring sustainable growth and competitiveness.
Continuous Improvement is a Journey
Beyond the numbers and analyses lies a deeper truth grounded by moral purpose: the spirit of continuous improvement is not just a methodology, but a mindset—an unwavering commitment to growth, innovation, and formative feedback. It’s about embracing challenges as opportunities, failures as lessons, and setbacks as springboards for greater success. By embracing collaborative inquiry schools can ensure they are always moving forward, never settling, and always seeking to do better for the students and families they support.
Read more in Leading Impact Teams 2.0